In many cases, project data should be reported to stakeholders who do not have MS Project installed or not experienced enough to work with. MS Project reporting to MS Excel or other visualization software are limited. Export to MS Excel allows to generate only the plain tables of project tasks, resources and assignments which is hard to use for analyzing the project progress, status, forecast, etc. Visual Reports on ‘Report’ tab are closer to analytical needs, however, their customization is not easy, and the resulting Pivot Tables in MS Excel could not be sent to any other keeping full functionality (internal structures with initial ‘local cube’ data are required to make Excel Pivot Tables working).
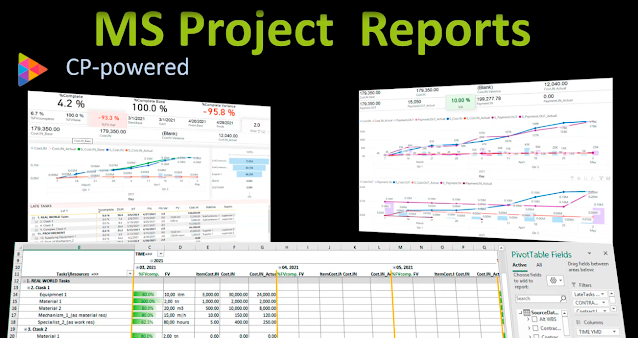
The reporting engine of Construction Project Add-In is designed to help MS Project users to get comfortable and ‘self-sufficient’ Excel/PowerBI reports. It is free and can be used for any projects. CP reporting generates Excel/PowerBI files with customizable Excel Pivot Tables and PowerBI visualizations based on active project data.

CP-reporting engine does the following:
- upload selected MS Project fields as row data to hidden ‘RawData’sheet of specially designed Excel template.
- Filled MS Excel template generates Power Pivot model to produce all required ‘good-looking’ Dimensions and Measures from row data loaded from active project.
- Dimensions and Measures is available to select from PivotTables Fields when you insert either PivotTable or PivotChart to Excel sheet.
- Default Reports have already created many of measures and dimensions commonly used in projects (Tasks, Resources, Time, Costs, Work, Duration, %Complete, Baselines e.t.c) and it is also possible to add new ones based on any MS Project custom fields uploaded (There is no hidden code used, everything can be viewed and modified in PowerPivot model)
- Power BI report is generated in similar way, but it does not take data from project directly. Excel report is used to take raw data from. Power BI reporting opens Power BI template specified in report settings changes data source to Excel report just generated and then refreshes data after opening. Power BI has similar Model to produce dimensions and measures used in PWBI visualizations.


0 comments: